Gilson Inc의 'Gradient Verification for Biological Separations Using the VERITY® 1810 Conductivity and pH Monitor'을 이용한 응용자료는 한국분석기기(주)에서 제공하였으며 주요 내용은 다음과 같다.
INTRODUCTION
Conductivity and /or pH monitoring are commonly used for biological separations and is necessary for the purification of oligonucleotides, monoclonal antibodies(mAbs), and other proteins. The VERITY® 1810 Conductivity and pH Monitor is a state-of-the-art detection instrument for biological purifications with a large dynamic range and rapid response time for real-time gradient monitoring.
This technical note highlights the ability of the VERITY® 1810 Conductivity and pH Monitor under TRILUTION® LC control to verify gradient composition during a chromatographic run.
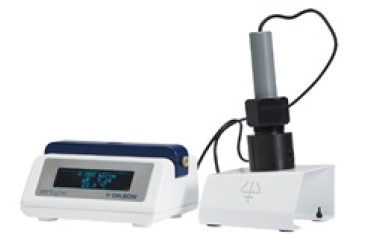
Figure1. VERITY® 1810 Conductivity and pH Monitor with Optional pH Flow Cell.
Materials & Methods
Standard Solutions
For conductivity monitoring, a solution of 100 mM phosphate buffer was prepared by dissolving powdered reagents in MilliQ purified water. MilliQ purified water was used as a solvent for the conductivity gradient.
For pH monitoring, solutions of 20 mM phosphate buffer and 0.1 M citric acid were prepared by dissolving powdered reagents in MilliQ purified water.
Instrumentation and Software
VERITY® 1810 Conductivity and pH Monitor with optional pH flow cell
•322 HPLC Pump (H1 heads)
•Minipuls®3 (for washing the pump heads)
•TRILUTION® LC
Conductivity Monitoring Methods
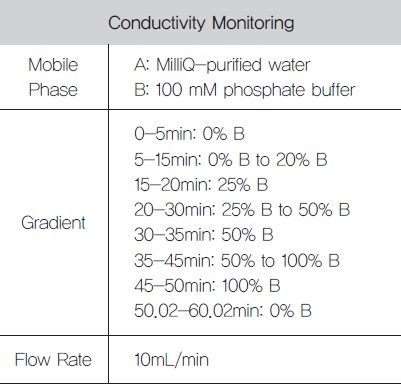
This experiment simulated use of a size exclusion or ion exchange column running a step gradient(Table 1) to mimic protein separation via buffers of varying ionic strengths.
This experiment was conducted at room uploaderature and in a refrigerated unit (~10°C).
Table 1. Conductivity Monitoring Gradient
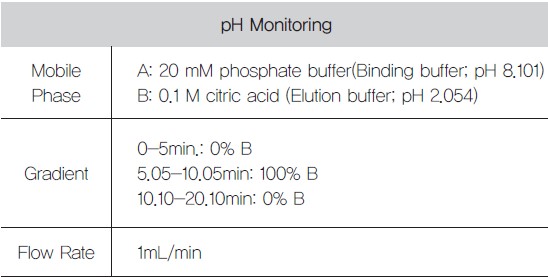
pH Monitoring Methods
The experiment simulated the use of a 1mL protein column to run a buffer exchange, loading with five column volumes of binding buffer, eluting with five column volumes of elution buffer, and equilibrating with ten column volumes of binding buffer(Table 2).
The VERITY® 1810 Conductivity and pH Monitor was used to monitor the mobile phase pH change with buffer composition change.
This experiment was run at room uploaderature and in a refrigerated unit (~12°C).
Table 2. pH Monitoring Gradient
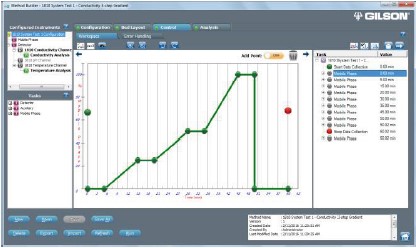
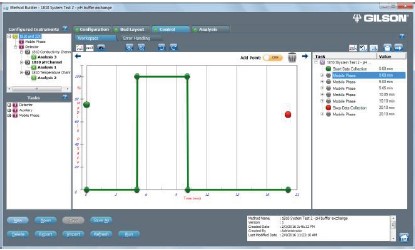
Figure 2. Example TRILUTION® LC method for conductivity monitoring
Figure 3. Example TRILUTION® LC method for pH monitoring
Results and Discussion
Conductivity Monitoring
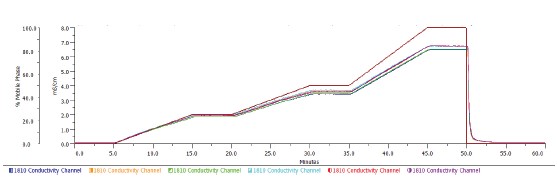
At both room uploaderature and at 10°C, the VERITY® 1810 Conductivity and pH Monitor effectively monitored the changes to the mobile phase composition between 0% and 100% phosphate buffer(Figure 4).
As the percentage of phosphate buffer increased, the VERITY® 1810 Monitor exhibited a corresponding increase in the conductivity signal. The VERITY® 1810 Monitor also indicated the return of the flow to effectively 0mS/cm with the transition to 0% phosphate buffer.
The results were similar at room uploaderature and at 10°C, demonstrating the ability of the VERITY® 1810 Monitor to collect conductivity data in different uploaderature environments without requiring recalibration.
Conductivity and uploaderature data were collected simultaneously during the run(data not shown).
Figure 4. Conductivity monitoring at room uploaderature(Aqua, Pink, Purple) and at 10°C(Blue, Orange, Green)in relation to mobile phase concentration(Dark red).
pH Monitoring
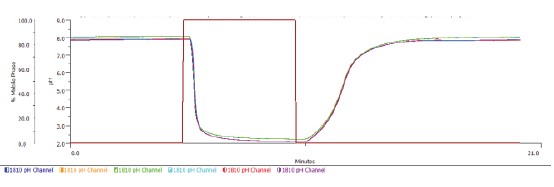
At both room uploaderature and at 12°C, the VERITY® 1810 Conductivity and pH Monitor effectively monitored the changes to the mobile phase composition, transitioning between 100% 20 mM phosphate buffer (pH 8) and 100% 0.1M citric acid (pH 2), and then returning to 100% 20 mM
phosphate buffer (pH 8) (Figure 5). The VERITY® 1810 Monitor accurately followed the changes in pH, showing that the monitor can be used to detect the pH of the system.
Results at room uploaderature were similar to results at lowered uploaderature, showing the ability of the VERITY® 1810 Monitor to collect pH data in different uploaderature environments. pH, conductivity, and data were collected simultaneously during the run (data not shown).
Figure 5. pH results at room uploaderature(Aqua, Red, Purple) and at 12°C(Blue, Orange, Green)in relation to mobile phase concentration(Dark red)
Summary
With the Gilson VERITY® 1810 Conductivity and pH Monitor, real-time conductivity, pH, and uploaderature signals are monitored efficiently andNeffectively, which allows the user to protect their valuable samples, ensure product purity, and optimize the purification process.
Gilson Inc의 'Gradient Verification for Biological Separations Using the VERITY® 1810 Conductivity and pH Monitor'에 대한 궁금한 내용은 본 원고자료를 제공한 한국분석기기(주)를 통하여 확인할 수 있다.
Rerference(참고문헌): Gilson Technical note TRANS0616
Model Name(모델명): VERITY®1810 Conductivity and pH Monitor
The Person in Charge(담당자): An Hyesook
Maker(제조사): Gilson Inc.
Country of Origin(원산지): U.S.A
e-mail: kaisco1@kaisco.co.kr
Data Services(자료제공): Gilson Inc.
<이 기사는 사이언스21 매거진 2020년 9월호에 게재 되었습니다.> |
|


 이전기사 :Application Note•q TOWER³ 84
 다음기사 :[연구자 인터뷰] 한국생명공학연구원(KRIBB) 책임연구원 이대희 박사