PerkinElmer Korea의 'Rapid and Sensitive Analysis of 17 Per-and Polyfluoroalkyl Substances in Water by Direct Injection with QSight 420 UHPLC/MS/MS'을 이용한 응용자료는 한국퍼킨엘머에서 제공하였으며 주요 내용은 다음과 같다.
"Introduction
Per- and polyfluoroalkyl substances (PFAS) represent a diverse group of synthetic fluorinated organic compounds that have been produced and widely used in industrial applications and consumer products since the late 1940s and early 1950s.
Common applications of PFAS include their use as additives in fluoropolymer production, surfactants in numerous consumer products, fire-fighting foams, stain resistant coatings for furniture and carpeting, nonstick cookware coatings, lubricants, breathable waterproof fabrics, paints, shampoos, coatings for food packaging (fast food wrappers and boxes) and other materials.
The unique physical and chemical properties of these compounds (highly stable and resistant to degradation), along with their ubiquitous use, have led to the accumulation of PFAS in the environment, with growing concern over human exposure to these chemicals.
Among PFASs, perfluorooctanesulfonate (PFOS) and perfluorooctanoate(PFOA) have been the most prevalent in the environment, and have thus attracted the most attention. Various PFASs have been found around the world in different water resources including drinking water, surface water, ground water and waste water.
High concentrations of PFAS were reported in water near crash and fire training military bases, likely owing to the use of aqueous film forming foam (AFFF) utilized as a fire suppressant.
As PFAS production shifted from Western to Asian countries, such as China, increased amounts of PFAS were detected in water samples collected from rivers and coastal drain outlets around the Bohai Sea, China.
To aid in the monitoring of PFAS in environmental matrices, several health advisory guidelines and recommended methods have been established. The United States Environmental Protection Agency (U.S. EPA) issued a health advisory limit of 70 parts per trillion(ppt) for PFOA and PFOS in drinking water.
The latestEuropean Commission adopted proposal for PFAS outlines limits of 100ng/L( ppt) for individual PFAS compounds, and 500ng/L for total PFAS concentrations. Some States in the USA have set even more stringent limits. For example, New Jersey has proposed health-based drinking water maximum contaminant levels (MCL) of 13ppt for perfluorononanoate (PFNA), 14ppt for PFOA and 13 ppt for PFOS.
The Minnesota Department of Health recently lowered the health-based advisory values for PFOS to 15ppt, down from the previous level of 27ppt set in 2017.
Further, in 2019, the Minnesota Department of Health set for the first time a health-based value for perfluorohexylsulfonate (PFHxS) at 47 ppt.
Experimental
Method
Standard and Sample Preparation
Primary PFAS standards were obtained from Wellington Laboratories (Guelph, Ontario). LC/MS grade methanol(MeOH) and water were obtained from Fisher Scientific. A mixed intermediate standard solution was prepared in methanol by dilution of the primary standard solutions. The mixed intermediate standard solution was diluted with 50% methanol to make calibration standards ranging from 0.5 to 2000 ng/L (ppt).
A variety of drinking water and surface water samples were analyzed in this study: bottled drinking water purchased from a local store(Woodbridge, Ontario); tap water obtained from two different cities in Ontario (Toronto and Kitchener); rain water collected from Kitchener, Ontario; river water samples from Japan and Ontario, Canada; and lake water samples from Lake Ontario, Canada.
The issue of contamination is of major concern for PFAS analysis.
Contamination is more common as the number of manual steps in the sample preparation method increases.
In this study, to minimize potential contamination, water samples were extracted with methanol (1:1 in v/v) and then analyzed directly, without further pretreatment. Further, all glassware and containers were rinsed with methanol, and then LC/MS grade water before use.
LC Conditions and MS Parameters
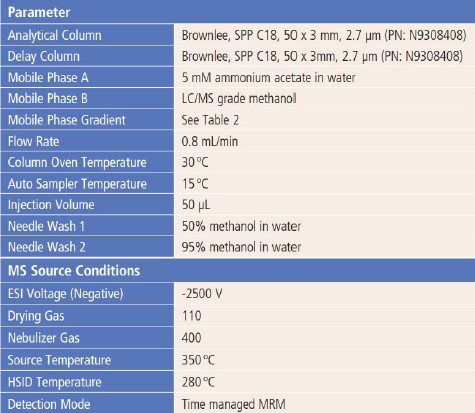
The LC method and MS source parameters are shown in Table 1.
Two C18 columns (Brownlee, SPP C18, 50 x 3mm, 2.7μm) were used in this study: one was used as a delay column to separate possible interferent PFAS compounds coming from the LC system; the other was used as the analytical column to separate PFAS compounds and any interfering components.
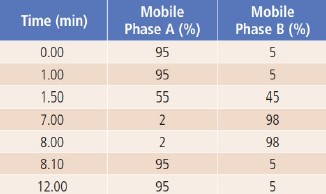
The applied LC gradient program is shown in Table 2.
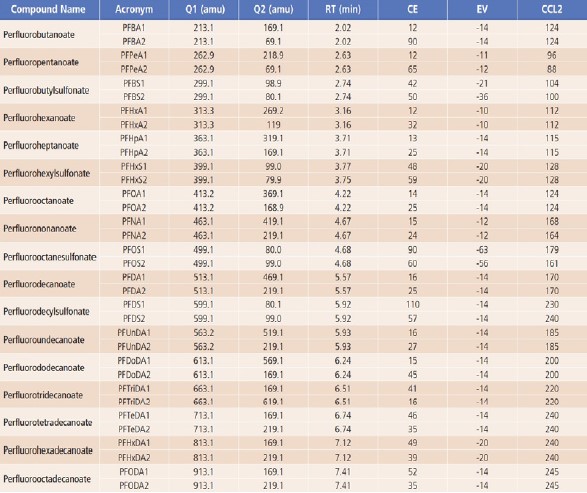
MS source parameters, including gas flows, uploaderatures and position settings, were each optimized to achieve maximum sensitivity. Compounddependent parameters, such as collision energies(CE), entrance voltages(EV), and lens voltages(CCL2), were optimized for the target compounds, as shown in Table 3.
During method development, the retention times for each PFAS compound were determined. Potential interfering PFAS components from the LC system and mobile phases were identified and separated from analyte peaks using a delay column.
Finally, the MS acquisition method was generated using Simplicity software in the time-managed-MRM module with the retention times and corresponding retention time windows for all PFAS compounds analyzed.
Table 1. LC Method and MS Source Conditions.
Table 2. LC Gradient Program.
Table 3. Optimized MRM Parameters for the 17 PFASs.
Results and Discussion
Contamination, Sample Matrix Effects and Carryover Effect
As previously discussed, system contamination is a major concern for the analysis of PFAS by LC/MS/MS. The contamination could be introduced through the mobile phases, containers, tubing, filters, fittings, pumps or pump seals used in the LC system.
To overcome this potential contamination issue, a delay column, as described earlier in the experimental section, was inserted between the mixing valve of the pump and the autosampler to trap and isolate PFAS compounds from the LC system.
As shown in Figure 1 and Figure 3 of a previous PerkinElmer publication, the analyte peaks can be well separated from the system contamination peaks by the delay column. Internal standard solutions could be another source of contamination, as identified in our previous study. Such contamination can lead to errors in quantification, especially at low concentration levels.
Thus, internal standards were not used in this study.
Sample matrix effects (MEs) are one of the main challenges in LC/MS/MS method development, validation, and applications, especially for complex sample matrices. In this study, sample MEs were evaluated by comparing the slopes of calibration curves obtained from standards prepared in a river water sample matrix/ methanol (1:1 by v/v) solution to slopes obtained from standards prepared in an LC/MS grade water/methanol (1:1 by v/v) solution. Sample ME (%) for each analyte was calculated by the percentage difference between the slopes. When the percentage difference is positive, there is a signal enhancement effect, whereas a negative value indicates a signal suppression effect. For example, the river water sample matrix had a signal enhancement effect for PFOA (ME=11%), while for PFUnDA, a signal suppression effect was observed (ME=-15%). The results obtained in this study are in line with other studies published on drinking and surface water analysis in that the sample matrix effects are less than 20%.
Further, an external calibration method can be applied for quantification without significant error, as the studied drinking and surface water matrices are relatively clean compared to industrial waste water.
The carryover effect was investigated by injecting the highest concentration calibration standard (2000ng/L in this case) followed by a blank injection. The results showed that the carryover effect was less than the LOQ of the method.
Effects of Methanol in Analytical Solution on the Analyte Response/Recovery
Owing to the lower solubility of long chain carbon analytes in aqueous solutions (in this study, those longer than C9), poor linearity and analyte responses or recoveries were observed when standards and QC samples were prepared in aqueous solutions containing less organic solvent, such as in a solution containing less than 50% of methanol.
To compare the relative responses and recoveries of the 17 PFAS compounds in solutions containing different amounts of methanol, three LFB sample solutions were prepared by spiking 1000ng/L of each analyte in three aqueous solutions containing methanol at concentrations of 5%, 50% and 100%, respectively.
The results showed that the responses and recoveries were good and consistent among the three solutions studied for the first nine analytes listed in Table 3 (from PFBA to PFOS).
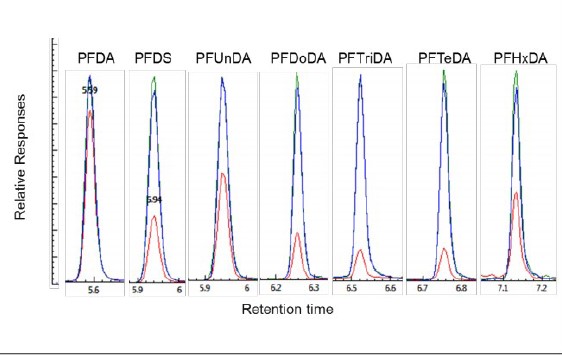
However, lower responses were obtained for the remaining eight analytes in the solution containing 5% methanol, as illustrated in Figure 1, with lower recoveries for these analytes from 80% for PFDA to less than 15% for PFTriDA and PFTeDA. The responses of these analytes were improved with recoveries close to 100% for all analytes when the methanol content in the sample was increased to 50%, and no significant differences were observed with a further increase in methanol content to 100% in the solution, as shown in Figure 1.
Similar results were also obtained by other researchers, and therefore, extra care should be taken to ensure that the composition of the stock, intermediate standards, calibration standards and samples maintain enough organic solvent to keep longer chain PFAS compounds in the analytical solution.
However, for a large volume direct injection method, a higher organic component in samples will lead to broad or splitting analyte peaks, especially for the earlier eluting analyte peaks, such as PFBA, PFPeA and PFBS.
Thus, the optimal strategy involves the preparation of two solutions that are injected separately; one solution prepared with 5% methanol for the first nine PFAS compounds analyzed, and the second solution prepared with at least 50% methanol for the remaining longer chain PFAS compounds.
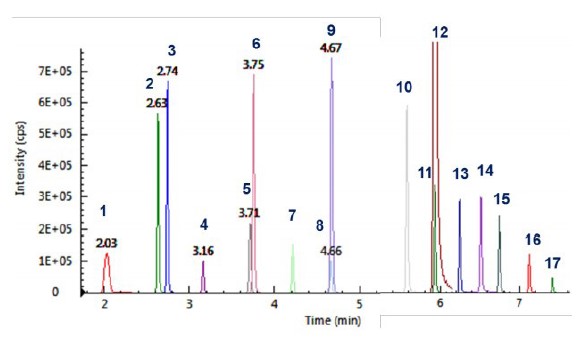
Figure 2illustrates the chromatograms of all 17 PFAS compounds analyzed.
Figure 1. Comparison of the analyte responses in three LFB sample solutions containing 1000ng/L of each analyte (red color, sample prepared in 5% methanol solution; green color, sample prepared in 50% methanol solution and blue color, sample prepared in 100% methanol).
Figure 2. MRM chromatograms of the 17 PFASs.
Linearity, Limit of Quantification (LOQ), QC Sample Results and Analyte Recovery
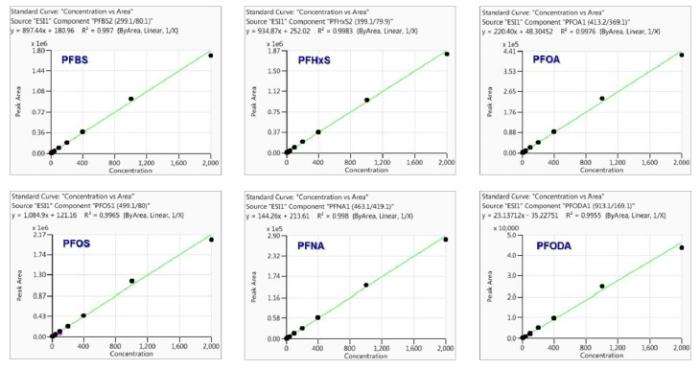
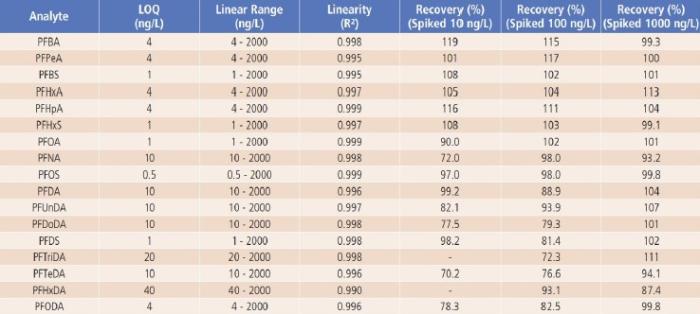
Method linearity was studied by external calibration method. As shown in Table 4 and Figure 3, good linearity was obtained for each analyte from low ng/L levels up to 2000ng/L, with regression coefficients (R²) greater than 0.99. The linear calibration ranges for all analytes are much wider than the suggested ranges (10-400ng/L) in the latest version of proposed U.S. EPA Method 8327.
The LOQ of the method was estimated based on the signal to noise ratio (S/N ≥ 10) of each analyte’s quantifier ion. As shown in Table 4, the estimated LOQs ranged from 0.5ng/L for PFOS to 40ng/L for PFHxDA, which are all less than or equal to the lower limit of quantification (LLOQ) suggested in the latest version of the proposed U.S. EPA Method 8327.
For QC sample analysis, after isolation of the LC system contaminants with a delay column, no other interference or contamination from reagents and glassware was observed, as demonstrated by the LRB sample results (LRB < LOQ). Good recoveries (close to 100%) were obtained for LFB samples, indicating no analyte loss or contamination during sample preparations (LRB and LFB data were not shown, but are available upon request). Analyte recoveries from the spiked river water samples (LFM samples) are between 70.2 to 119% as shown in Table 4, demonstrating good accuracy of the method.
The method’s selectivity and analyte confirmation from samples were evaluated by comparing the analyte retention time and MS information between reference standard and tested samples.
According to the regulatory guidance on analytical method validation, at least two MS/MS transition ion pairs were used in the method, and the product ion ratios (qualifier vs. quantifier) were within 20% tolerance windows of the expected values.
Figure 3. Example calibration curves with concentrations up to 2000ng/L(ppt).
Sample Analysis
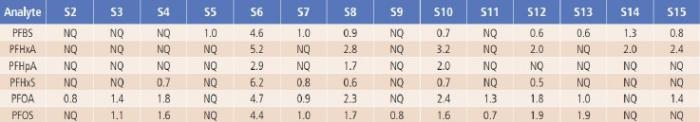
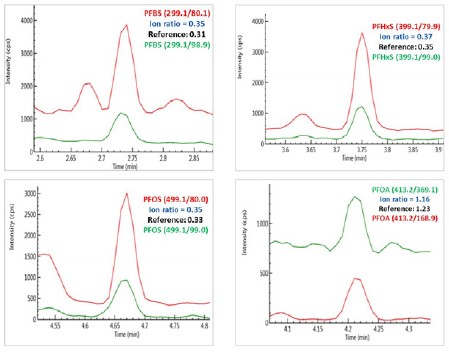
The developed LC/MS/MS method was applied for the analysis of PFAS in 15 water samples including drinking water, rain water, river water and lake water samples. As shown in Table 5, among the seventeen PFAS compounds, six of them were found in river water, Figure 4.
Chromatograms of PFBS, PFHxS, PFOS and PFOA obtained from sample S6 (Red - quantifier ion pair; and green, qualifier ion pair).
lake water and some tap water samples, although their amounts are much lower than any of the drinking water health advisory limits. The concentration of all analytes from a commercially available bottled drinking water sample (S1) are very low and not quantifiable (NQ), and thus are not listed in Table 5.
Table 4. The Method’s LOQ, Linear Range and Recovery Results.
Table 5. The Measured PFASs Results from the Tested Water Samples in ng/L (ppt).
Figure 4. Chromatograms of PFBS, PFHxS, PFOS and PFOA obtained from sample S6 (Red - quantifier ion pair; and green, qualifier ion pair).
The identity of the analytes in these samples was confirmed by comparing the analyte retention time and the ion ratios of the qualifier ion against the quantifier ion in the samples with those in the reference standards. For an example, as illustrated in Figure 4, the ion ratios of the qualifier ions against quantifier ions in a local river water sample (S6) for PFBS, PFHxS, PFOS and PFOA are consistent with those obtained from their reference standards, positively confirming the existence of these analytes in the water sample.
These results demonstrated the superior sensitivity and selectivity of the QSight 420 LC/MS/MS system for analysis of PFAS in water.
Conclusions
A simple, rapid, sensitive and cost-effective LC/MS/MS method has been developed and validated for the analysis of 17 PFASs in drinking and surface water samples at sub to low ng/L (ppt) levels by coupling a LX50 UHPLC system to a QSight 420 triple quadrupole mass spectrometer. In addition to its high sensitivity, the method showed a wide linear dynamic range and eliminated the SPE sample preparation procedures, and therefore not only reduced the cost and saved time for sample analysis, but also prevented potential contamination from SPE sample preparation steps.
The method has been applied for real water sample analysis with good accuracy."
'Rapid and Sensitive Analysis of 17 Per-and Polyfluoroalkyl Substances in Water by Direct Injection with QSight 420 UHPLC/MS/MS'에 대한 궁금한 내용은 본 원고자료를 제공한 한국퍼킨엘머를 통하여 확인할 수 있다.
Reference(참고문헌): PerkinElmer Rapid and Sensitive Analysis of 17 Per-and Polyfluoroalkyl Substances in Water by Direct Injection with QSight 420 UHPLC/MS/MS
Model Name(모델명): QSight™ LC/MS/MS
The Person in Charge(담당자): Wangyu kim
Maker(제조사): PerkinElmer
Country of Origin(원산지): U.S.A
e-mail: Wang-yu.kim@perkinelmer.com
Data Services(자료제공): PerkinElmer Korea
| <이 기사는 사이언스21 매거진 2021년 2월호에 게재 되었습니다.> |
|


 이전기사 :바이오 제약 산업을 위한 단백질 안정성 분석 기술
 다음기사 :Application Note·PlasmaQuant® PQ 9000 Elite