PerkinElmer의 'Analysis of 16 Cannabinoids Using the PerkinElmer LC 300 HPLC System with Photodiode Array Detection'을 이용한 응용자료는 퍼킨엘머 코리아에서 제공하였으며 주요 내용은 다음과 같다.
Introduction
Current trends for the analysis of the cannabinoid content in commercially available cannabis flower and fortified products, such
as foods, depend on liquid chromatography for ensuring labelclaim accuracy in product content descriptions.
As the use of cannabis products increases with state-level recreational legalization, complete and robust quantification of a
range of cannabinoid compounds becomes increasingly important, as failure to do so can result in negative health impacts, as well as a loss in consumer confidence. Recent studies of edible cannabis products purchased from licensed dispensaries in the
state of California revealed that only 17% of the 75 edible products purchased were labelled accurately, with the remaining either
under-labeled(23%) or over-labeled(60%) with respect to THC content¹.
Thereupon, this work describes a simple and fast chromatographic method for the analysis of sixteen commonly analyzed
cannabinoids.
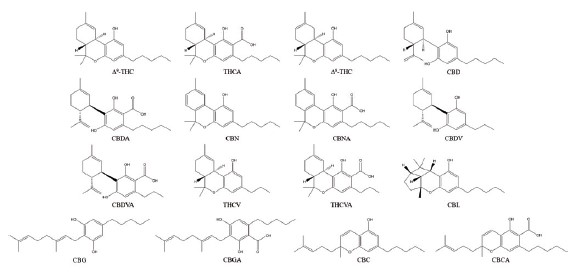
The cannabinoid structures are shown in Figure 1.
Experimental
Hardware/Software
Chromatographic separation was achieved using a PerkinElmer LC 300 HPLC system, consisting of an LC 300 10k psi pump and an LC 300 autosampler equipped with an integrated column oven.
Detection was achieved using an LC 300 Photodiode Array(PDA) detector. Instrument control, analysis and data processing were
performed using the Simplicity™Chrom CDS software platform.
Method parameters
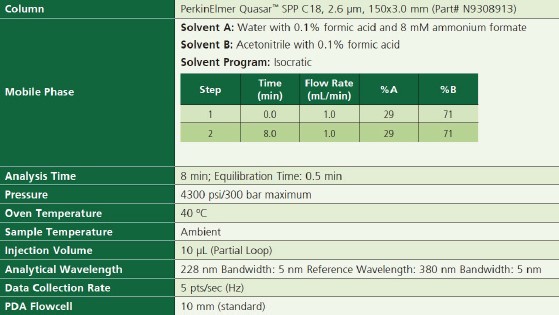
The LC parameters are shown in Table 1.
Figure 1. Chemical structures of the sixteen cannabinoids analyzed in this study.
Table 1. LC Parameters.
Solvents and Standards
All solvents used in this method were HPLC grade. Unless otherwise specified, standard dilutions were prepared using 80:20
methanol/water.
The sixteen 1-mg/mL cannabinoid standards were obtained from Cerilliant®(Round Rock, TX).
These included: Δ9-tetrahydrocannabinol(Δ9-THC), Δ9-tetrahydrocannabinolic acid(THCA), Δ8-tetrahydrocannabinol(Δ
8-THC), Cannabidiol(CBD), Cannabidiolic acid(CBDA), Cannabinol(CBN), Cannbinolic acid(CBNA), Cannabigerol(CBG),
Cannabigerolic acid(CBGA), Cannabichromene(CBC), Cannabichromenic acid(CBCA), Cannabidivarin(CBDV), Cannabidivarinic acid(CBDVA), Tetrahydrocannabivarin(THCV), Tetrahydrocannabivarinic acid(THCVA) and cannabicyclol(CBL).
A 50-μg/mL stock standard mix solution was prepared by pipetting 1mL of each standard into a 20mL volumetric flask, and filling to
the mark with water. This stock standard mix also served as the Cal-L6 calibration standard.
Additional calibrants were prepared by serially diluting the standard mix to concentration levels of 25, 10, 5, 1, and 0.4μg/mL, providing a 6-level calibration set.
Results and Discussion
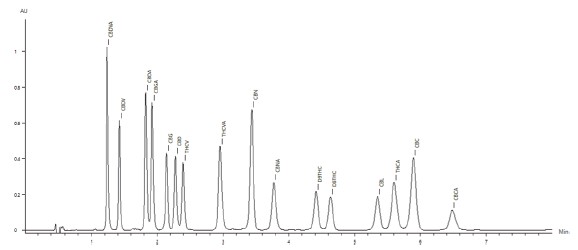
The chromatogram of the 50μg/mL standard is shown in Figure 2, with all sixteen cannabinoids eluting in under seven minutes.
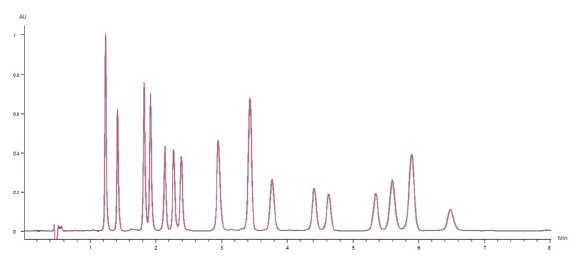
Figure 3 shows the overlay of 10 replicate 50μg/mL cannabinoid standard injections, demonstrating exceptional reproducibility. All
analyzed cannab had a peak retention time precision(%RSD) of less than 0.16%, and a peak area precision of less than 0.7%(With most analytes below 0.5%).
Figure 2. Chromatogram of the the 50μg/mL cannabinoid standard.
Figure 3. Chromatographic overlay of 10 replicates of the 50μg/mL cannabinoid standard.
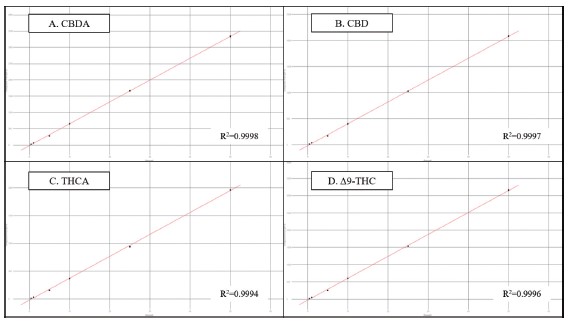
Figure 4 shows the calibration results for four representative cannabinoids over the concentration range of 0.4 to 50μg/mL.
All sixteen cannabinoids followed a linear(1st order) fit, and had R² coefficients greater than 0.999(n=3 at each level).
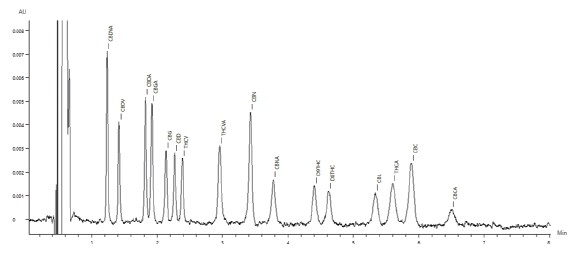
The chromatogram of the low-level 0.4μg/mL cannabinoid standardis shown in Figure 5.
Figure 4. Results for the 6-level calibration sets for four example cannabinoids.
Figure 5. Chromatogram of the the 0.4μg/mL cannabinoid standard.
An 80:20 methanol/water solvent blank was injected following triplicate injections of the Cal-L6(50μg/mL) standard, and no
carryover was observed for any of the sixteen cannabinoids.
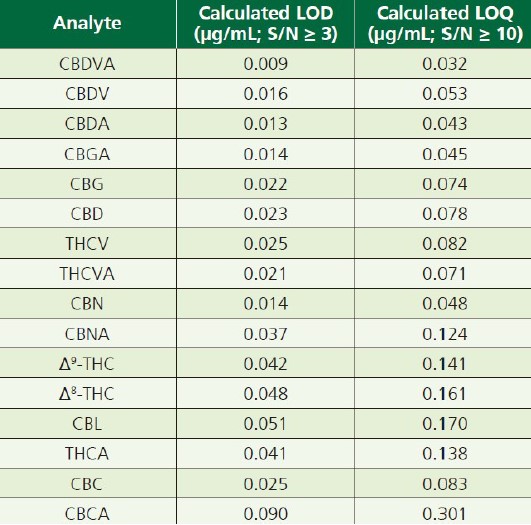
As listed in Table 2, LOQ(limit of quantitation) levels were established for each analyte based upon the averaged response and signalto-noise ratio for the level 1(0.4μg/mL) calibration standard, run in triplicate.
Table 2. LOQs for the sixteen analytes, in order of elution.
Conclusion
This work has demonstrated the fast and robust chromatographic separation and quantitation of sixteen commonly analyzed cannabinoids using a PerkinElmer LC 300 HPLC system with PDA detection.
The results exhibited very good retention time repeatability, as well as excellent linearity over the tested concentration ranges. The method also affords LOQs of ≤ 0.15μg/mL for most analytes.
References(참고문헌) :
1. Vandrey R, Raber JC, Raber ME, Douglass B, Miller C, Bonn-miller MO. Cannabinoid Dose and Label Accuracy in Edible Medical Cannabis Products. JAMA. 2015;313(24):2491-3.
2. Cannabis oil vs hemp seed oil; Cannabis oil, CDB Oil, Medical Marijuana. http://cbd.org/cannabis -oil-vs-hemp-oil
'Analysis of 16 Cannabinoids Using the PerkinElmer LC 300 HPLC System with Photodiode Array Detection'에 대한 궁금한 내용은 본 원고자료를 제공한 퍼킨엘머 코리아를 통하여 확인할 수 있다.
Model Name(모델명): LC300
The Person in Charge(담당자): Wang-yu, Kim Ph.D.
Maker(제조사): PerkinElmer
Country of Origin(원산지): USA, Netherlands
Mail inquiry: wang-yu.kim@perkinelmer.com
Data Services(자료제공): PerkinElmer Korea
<이 기사는 사이언스21 매거진 2021년 7월호에 게재 되었습니다.>
|
|


 이전기사 :XRF를 이용한 제약원료의 쉽고 빠른 원소분석 및 생산 모니터링
 다음기사 :마이크로웨이브 합성의 영역을 확장하다